Application Notes: Surprises with Cables
How to troubleshoot electrical artifacts using the FemtoDAQ Kingfisher
Designing an experiment is sometimes more of an exercise in identifying artifacts and sources of noise than in data collection. Today we’re going to analyze some electronics artifacts that can interfere with the collection of waveforms, and how you can identify and debug the problem using the visualization tools on the FemtoDAQ Kingfisher.
This document can be viewed in .pdf format here.
Let’s first consider the experimental setup we have (which will be different from yours)! We have a NIM Pocket Pulser connected with RG-174 cable to Channel 0 of our 100 MHz FemtoDAQ Kingfisher, with input termination set to 10 kOhms. A photo of this setup is shown in Fig. 1.
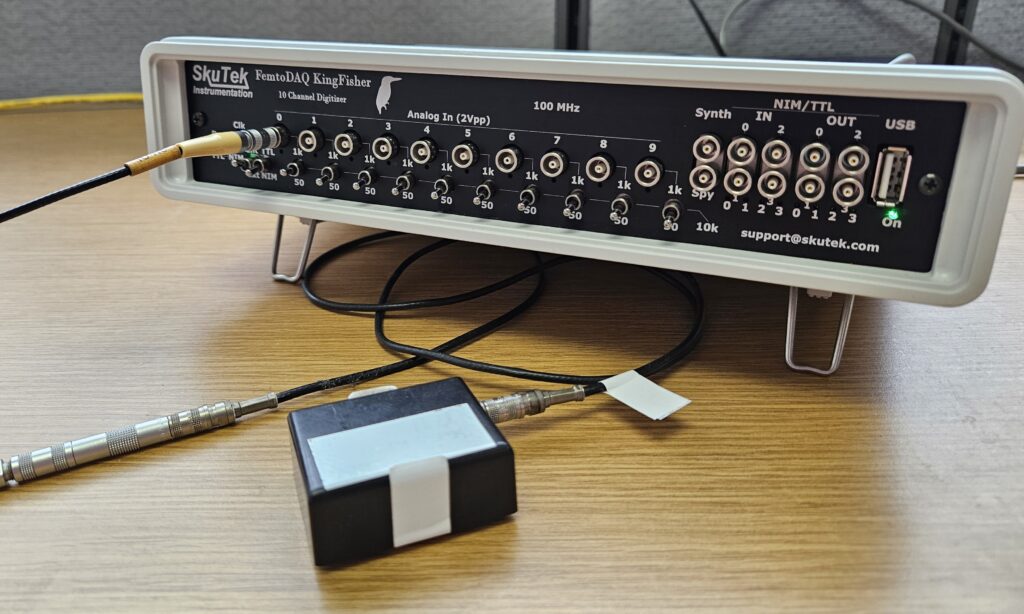
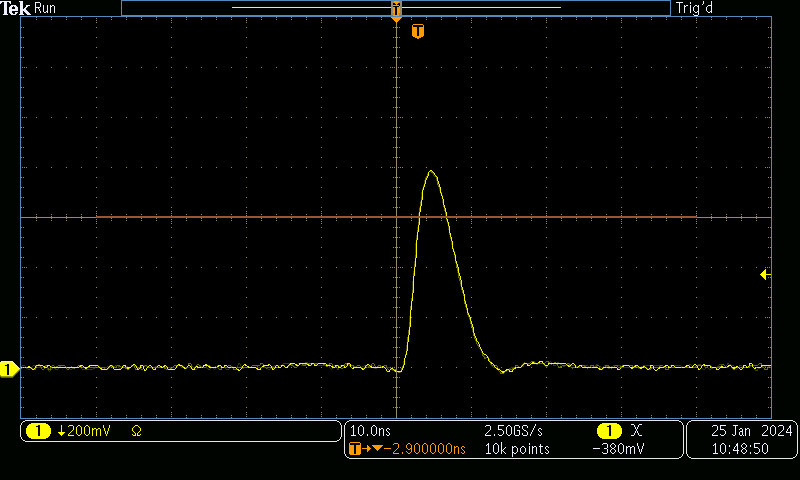
Note that the cable comprises 5 separate cables, 4 of which are labeled “10 ns” and 1 is labeled “5 ns”. This is manufacturer labeling that signifies the propagation time of signals in these cables. So for now, the cable length is 45ns. The NIM Pocket Pulser is battery powered and generates short pulses of ~-0.8V (NIM Logical 1) thousands of times a second. The typical output from this device is pictured in Fig. 2.
So, with the setup shown and described in Fig. 1, what will we see in the Kingfisher’s GUI when we capture a waveform?
The result is shown in the figure below:
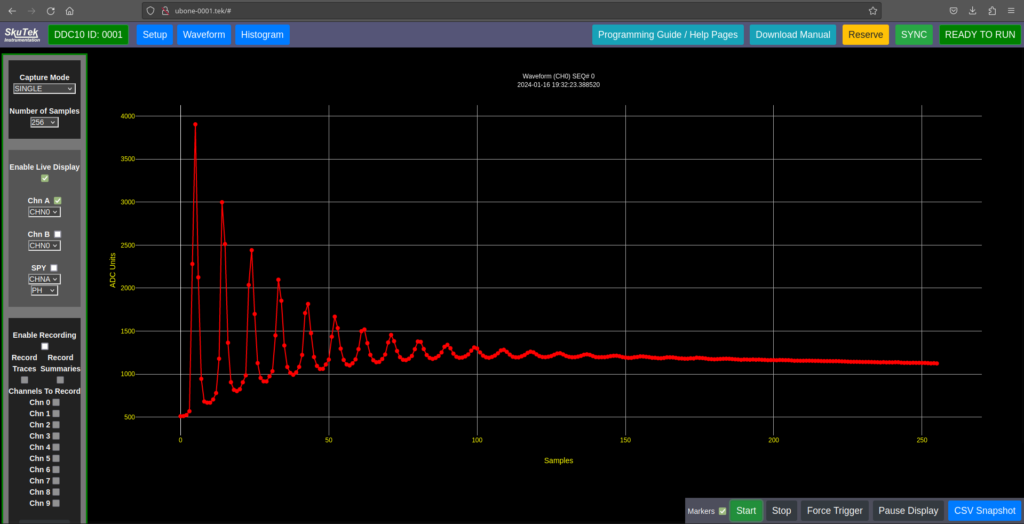
For the first few samples the pulse appears as it should – a quick rise followed by an exponential decay, but then we see a secondary peak, and then a third – a whole series of pulses slowly decreasing in amplitude. Following these, the baseline has risen significantly from before the first pulse, and itself appears to be slowly decaying.
What is happening here?
We know from Fig. 2 that we should see a single, neat pulse from the Pocket Pulser. A single peak has somehow turned into a set of decaying pulses and now we can’t adequately characterize the decay profile because of these extra pulses in our data.
Is the digitizer broken? No, we will show that this effect happens with a functioning Kingfisher.
Is it crosstalk with another channel on my digitizer? We only have the NIM Pocket Pulser plugged into the Kingfisher, so there can be no crosstalk from other channels.
So what is happening? Let’s zoom in on the Kingfisher’s waveform display to get a closer look. We can do this by selecting the area on the waveform that we want to highlight:.
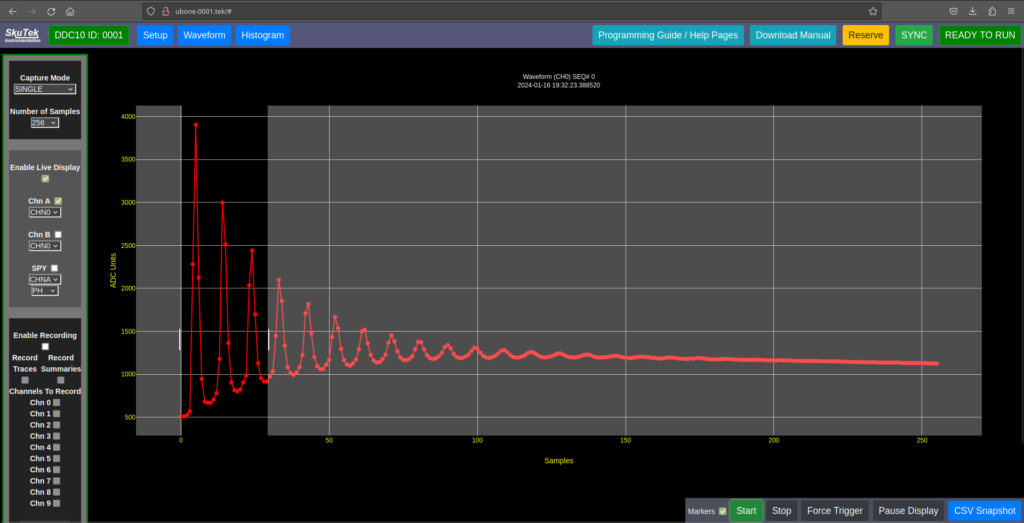

We see our expected original pulse, and then two more pulses. The pattern is very regular – these additional pulses are spaced by roughly 9 samples and resemble two lower amplitude copies of our original pulse. So, what is causing these copies of our pulse and how do we remove them? To figure it out, we can change the parameters in our system and see how the digital waveform changes in response. There are two parameters in particular we will modify: Input Termination and Cable Length.
Changing the Input Termination
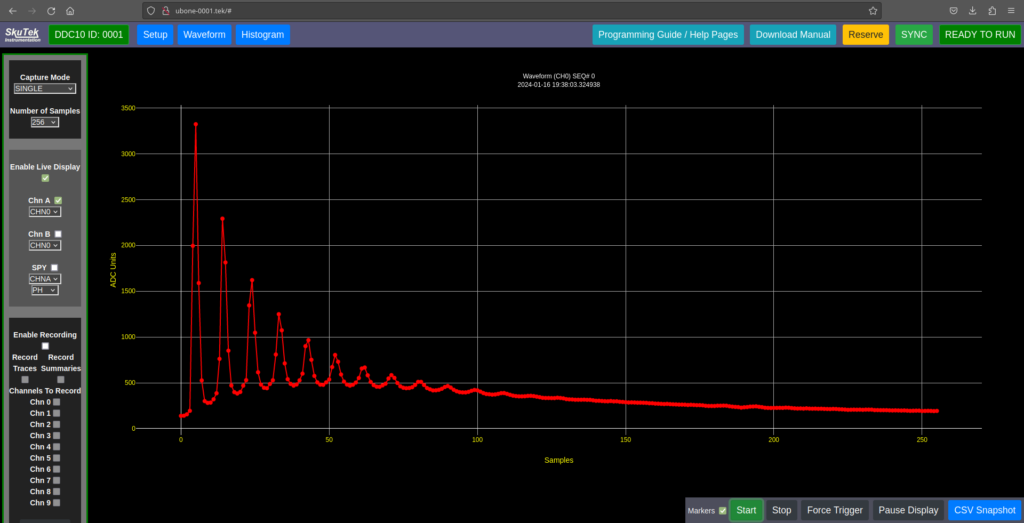
First, we lower the input termination of this connection from 10 kOhms to 1 kOhms (by changing the switch for Channel 0 on the Kingfisher’s front panel), and capture another waveform. The result in the Kingfisher’s GUI is shown in Fig. 5.
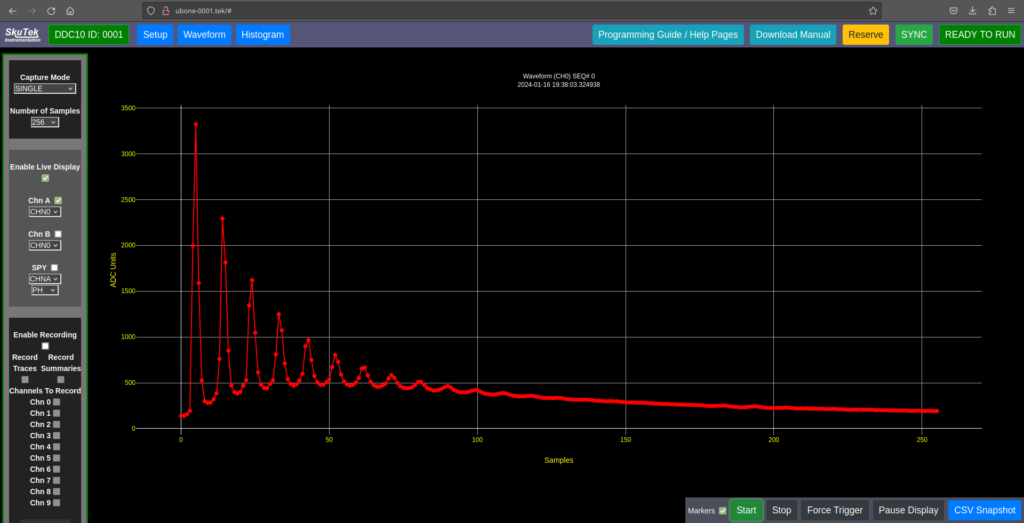
Although we decreased the input termination by an order of magnitude, we are still seeing a series of pulses. Something very interesting happens if we set the input termination to 50 Ohms, and capture another waveform, shown in Fig. 6.
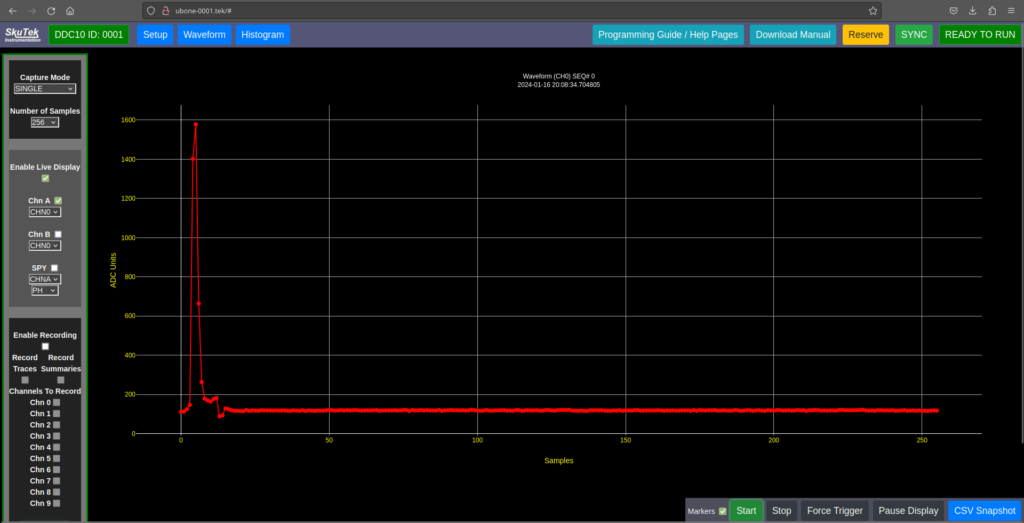
This is much closer to what we expected! The copies of the original pulse are almost gone, with a single small “bump” after the first pulse. Remember, all we have done is changed the input termination on the Kingfisher. How did this remove the extra pulses? To answer this, let’s look at a diagram of the circuit formed when the NIM Pocket Pulser is connected to the Kingfisher:
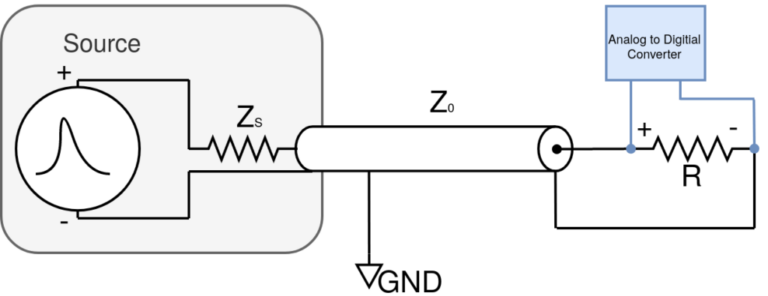
We can see the input termination we have been varying, R, but there is also a term Z0 known as the Characteristic Impedance of the cable. For our RG-174 cable we have a nominal Characteristic Impedance of 50 Ohm [1]. Recall that for input terminations of 10 kOhm and 1 kOhm, we saw additional pulses, but with an input termination of 50 Ohm, we saw almost no additional pulses! In reality, we’ve been testing an important electronics concept called Impedance matching. This fact confirms that the extra pulses seen in the waveforms taken with mis-matched impedance are in fact reflections [2] [3]. The original single pulse is reflecting back and forth in our cable. As it turns out, any signal propagating through a transmission line (or in this case, input cable) can be subject to reflections, just like light or sound within a medium. At the load end of the transmission line, the equation governing the ratio of reflected wave amplitude to the incident wave, ρ, is:
(Eq. 1) ρ = (R – Z0) / (R + Z0)
Which for our Z0 = 50 Ohm cable yields reflection coefficients of ~0.99, ~0.90, and 0 for 10 kOhm, 1 kOhm, and 50 Ohm termination respectively. Note that when the load impedance is matched to the characteristic impedance of your cable, there are no reflections. The small reflection present in the waveform in Fig. 6 is explained by the fact that the input termination on the Kingfisher is not exactly 50 Ohm, giving a small reflection… but wait! We didn’t mention how this pulse “bounces off of” the NIM Pocket Pulser (the pulse does reflect back and forth). Thankfully, Equation 1 also applies to the Pocket Pulser “side” of the cable, with R -> ZS, the NIM Pocket Pulser’s impedance. Here we silently assume that ZS is high compared to the cable’s characteristic impedance (in other words: ZS >> Z0). This results in what we see: a pulse that loses some amplitude with every bounce on both ends, and we are sampling (or “seeing”) every other bounce with the Kingfisher.
A final feature to note about the collected waveforms is that the overall amplitude of the pulses decreases as the input termination is decreased. This is explained by studying Fig. 7 and considering Ohm’s Law for resistor Z0:
(Eq. 2) VZ0 = I Z0 * Z0
If we apply Ohm’s law here, increasing this resistance from 1 kOhm input termination to 10 kOhm should result in a peak 10x higher, right? Why then, are the peak amplitudes of pulses in Fig. 5 (~3300 ADC counts) so close to Fig. 3 (~3900 ADC counts)? As we change the input termination from 1 kOhm to 10 kOhm, we are hitting a power limit for the NIM Pocket Pulser in the system. We are subject to the constraint:
(Eq. 3) VZ0 * I Z0 ≤ Pmax
With the load changing: 1 kOhm → 10 kOhm, the voltage will increase but only up to a point, then the current across Z0 will need to decrease to compensate for the power limit Pmax. Knowing the constraints of your system will inform the results you get!
Changing the Cable Length
Now, what will happen to the “picket fence” pattern of pulses if we change the length of our cable? We begin with the original setup shown in Fig. 1. For a particular cable, it’s characteristic impedance (in our case, Z0 = 50 Ohm), does not change with cable length [1]. So what will happen to the reflections we see in Fig. 3 if we make our cable shorter?
First, let’s remove two “10 ns” sections of cable to make the resulting transmission line “25 ns long”, and repeat our measurement with the Kingfisher. Note that we are leaving the input termination at 10 kOhm. Fig. 8 shows the resulting waveform in the GUI.
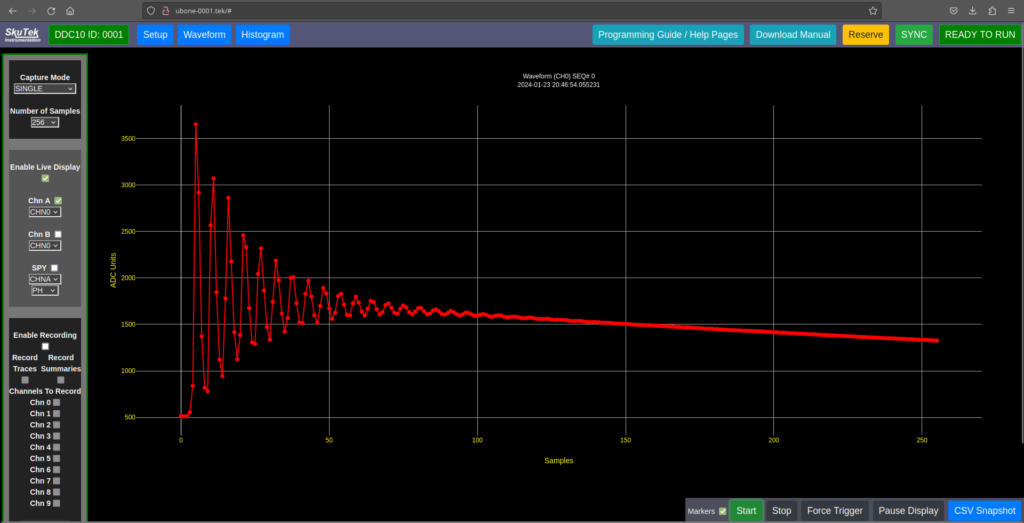
The same reflections seen previously are now closer together in time (or, samples)! What do you think we will see if we remove another 20 ns of cable to make the transmission line “5 ns long”? The result is shown in Fig. 9:
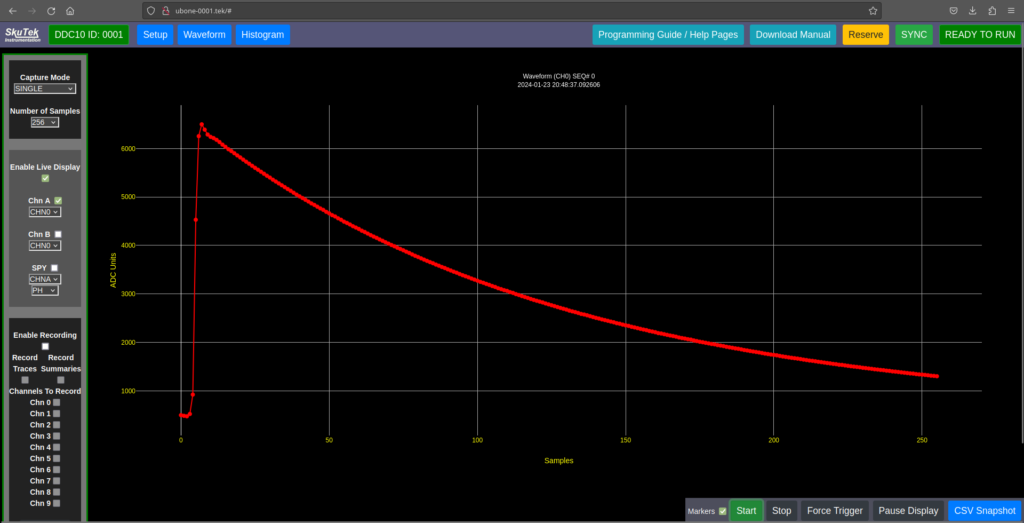
The waveform now appears as a smooth, decaying curve. What is going on?
The final bit of knowledge we need is knowing the sample rate of our digitizer. The FemtoDAQ Kingfisher we use here digitizes at 100 MSPS (Megasamples per second), which would make the length, in time, of each ADC sample 10 ns. With this in mind, consider the waveforms (seen in Figs. 3, 5, and 6) where we use 45 ns of cable. This would result in a 90 ns round-trip time (from digitizer -> NIM Pocket Pulser -> Digitizer) for any reflecting signals within this cable. In other words, we would expect a 9-sample gap in-between each digitized reflected pulse… which we do see in Fig. 4. This same logic describes what we see in Fig. 8 as well, where 25 ns of cable would give a 50 ns round-trip, and so we expect (and see) 5 samples between reflections. Now, why do we see a steady decay in Fig. 9? Here, there is only 5 ns of cable, giving a 10 ns round-trip… which happens to be our sample width. In this case, we are only ever sampling the peaks of each reflection, and so we see a “smooth” decay!
Summary
The task of digitizing single pulses from a NIM device can quickly present many important electronics concepts that result in waveforms that are not a single, clean pulse. For the experiment we demonstrated today, waveforms for many combinations of cable “length” and input termination are plotted outside of our GUI in Fig. 10.

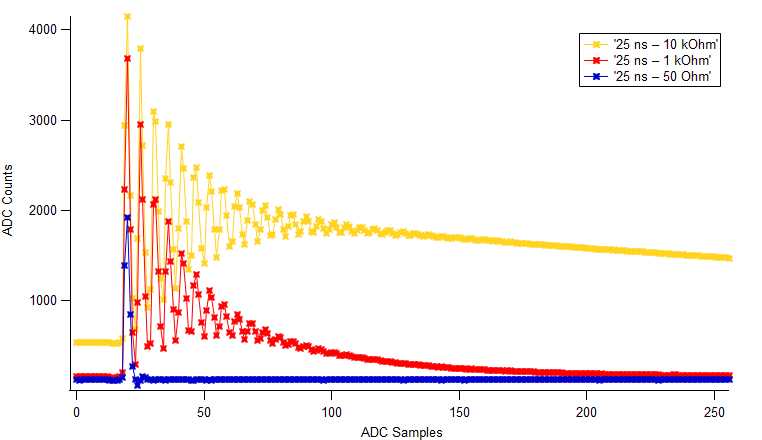
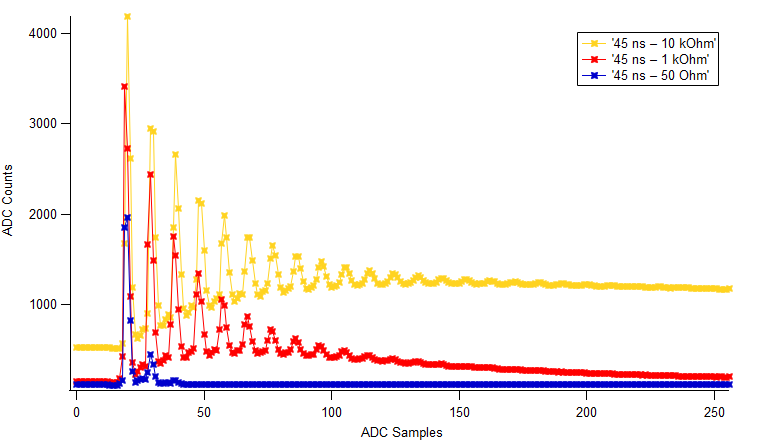
Understanding the concepts of characteristic impedance, impedance matching, and the travel time of signals in your cable will inform you on how to set up a data acquisition experiment. This particular experiment highlights the importance of considering every piece of an experimental configuration. Any small change in the setup can affect your results in ways you might not expect!
[1] Pasternack RG-174 Datasheet, https://www.pasternack.com/images/ProductPDF/RG174A-U-BULK.pdf
[2] Howard Johnson and Martin Graham, High Speed Digital Design: A Handbook of Black Magic.
[3] P. Horowitz’s W. Hill’s, The Art of Electronics 2nd edition (1989)
Author: Jackson Hebel
Copyright © SkuTek Instrumentation 2024

