This page is automatically generated from a Jupyter Notebook.
Download the original notebook using the button below.
Download the original notebook using the button below.
Histogramming Pulse Summary (DSP) Quantities on FemtoDAQ Vireo
[17]:
import matplotlib.pyplot as plt
import numpy as np
import skutils
Put your file paths here
[26]:
FILENAMES = [r"C:\Users\SkuTek\Downloads\cs137_relative_timestamp_test_03.07.06PM_Dec05_2025_seq000001.itx"]
Predefine Quantity lists
[27]:
# Channel 0 Data
ch0_pulse_heights       = []
ch0_trigger_heights     = []
ch0_relative_timestamps = []
# Channel 1 Data
ch1_pulse_heights       = []
ch1_trigger_heights     = []
ch1_relative_timestamps = []
Iterate through events and append to the quantity lists
[28]:
for event in skutils.quickLoad(FILENAMES):
    # Channel0
    ch0_pulse_heights.append      ( event[0].pulse_height               )
    ch0_trigger_heights.append    ( event[0].trigger_height             )
    ch0_relative_timestamps.append( event[0].relative_channel_timestamp )

    # Channel1
    ch1_pulse_heights.append      ( event[1].pulse_height               )
    ch1_trigger_heights.append    ( event[1].trigger_height             )
    ch1_relative_timestamps.append( event[1].relative_channel_timestamp )
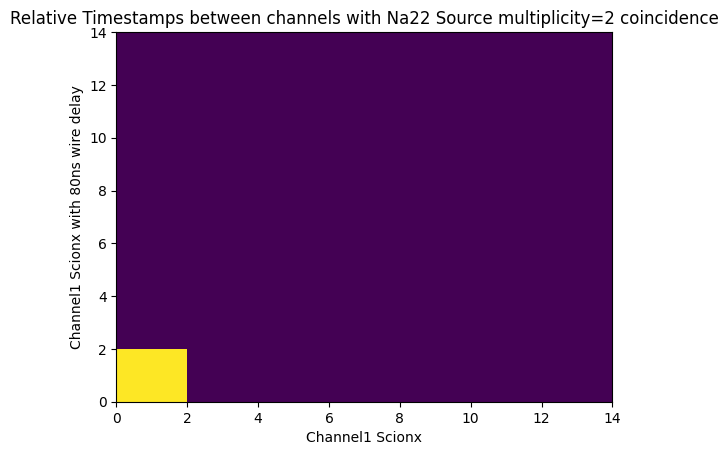
Example 2D histogram of Pulse Heights
[29]:
fig = plt.figure()
ax1 = fig.add_subplot(111)
ax1.set_xlabel("Channel1 Scionx")
ax1.set_ylabel("Channel1 Scionx with 80ns wire delay")
ax1.set_title("Relative Timestamps between channels with Na22 Source multiplicity=2 coincidence")
res = ax1.hist2d(ch0_relative_timestamps, ch1_relative_timestamps, bins=[range(0,16,2),range(0,16,2)])
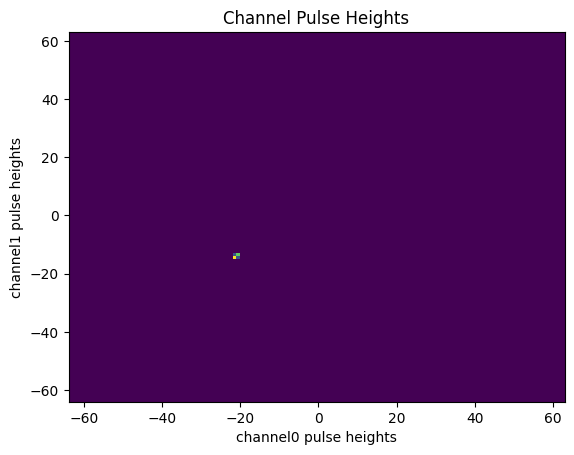
[30]:
# plot:

fig, ax = plt.subplots()
ax.set_xlabel("channel0 pulse heights")
ax.set_ylabel("channel1 pulse heights")
ax.set_title("Channel Pulse Heights")
res = ax.hist2d(ch0_pulse_heights, ch1_pulse_heights, bins=[range(-64,64,1),range(-64,64,1)])