This page is automatically generated from a Jupyter Notebook.
Download the original notebook using the button below.
Download the original notebook using the button below.
Processing Waveforms from your events
[1]:
import matplotlib.pyplot as plt
import numpy as np
import skutils
%matplotlib inline
Skutils is in beta, please contact support@skutek.com with bugs, issues, and questions
Put your file paths here
[27]:
FILENAMES = [r"C:\Users\Jeff\Downloads\cs137_relative_timestamp_test_11.54.31AM_Mar12_2026_seq000001.itx"]
Prep the Plot
[38]:
fig,ax = plt.subplots(1,1)
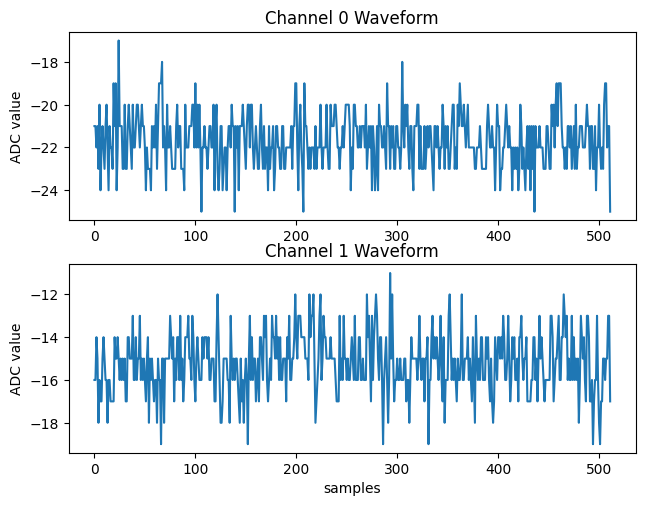
ax.set_title("Channel 0 Waveform")
ax.set_ylabel("ADC value")
ax.set_xlabel("samples")
for event in skutils.quickLoad(FILENAMES):
ch0_wave = event[0].wave
ax.plot(ch1_wave)
plt.show()
[ ]: